Flow Processes in the Soil Water System
Equations for Steady-State Model of Soil Water System
RETURN TO HYDROSPHERE PAGE
RETURN TO MAIN PAGE
Introduction
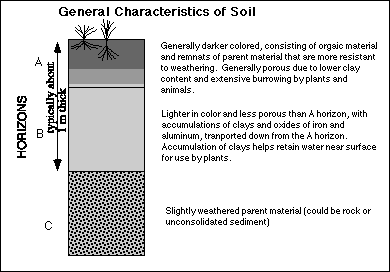
The soil is essentially the living skin of the Earth and it is of tremendous importance to all people primarily because it is the foundation upon which our whole agricultural system rests. In simple terms, soil consists of the weathered remains of whatever rocks occur naturally within a region, along with variable amounts of organic material. The weathered material is produced by chemical and physical weathering processes and it is modified by the activities of plants and animals and microorganisms. Most of the chemical weathering that occurs within the soil involves the dissolution of minerals by various acids, mainly carbonic acid formed by carbon dioxide and water. In addition, acids used in weathering are formed by the activities of various micro-organisms living in the soil. These microbes within the soil also play a major role in the growth of plants by breaking down organic and mineral material into forms that are usable by plants. A consequence of all of the processes that occur within the soil is the formation of layers or horizons, as shown in the diagram below.
If you are used to looking at layers of rock and you are familiar with the Law of Superposition (which says that in a sequence of sedimentary rocks, the lowest is the oldest and the highest is the youngest), you might be misled by the stratified nature of a soil. Soil horizons develop within some parent material and slowly work their way down from the surface, so the A and B horizons form simultaneously. Depending upon a variety of factors, including the climate, the organisms present, the parent material, and the topography, it may take from several hundred to several thousand years to develop a complete, "mature" soil profile. This period of time needed to form soil will be important to a later modeling exercise in which we investigate how soil as a resource may limit human population growth.
One of the most important features of soil, from the standpoint of it's water-holding capacity is the variation in porosity with depth. Porosity is a measure of the open space within some soil or rock and it is function of the sizes of particles and the way they are arranged. Pore spaces represent the reservoir for holding water and a related parameter, called permeability, controls how quickly water will flow through some material -- it is related in part to how connected all of the pore spaces are. Weathering of minerals in the A horizon commonly produces clay minerals and these clays are transported downward, accumulating in the B horizon. Clays tend to reduce the porosity and permeability of soil material and many types of clays have the ability to absorb water like tiny sponges; this absorption causes them to swell and further reduce the porosity and permeability. This leaves the A horizon with a higher porosity and the B horizon with a relatively smaller porosity and reduced permeability, with helps to effective retain water in the soil for use by plants.
It may help to develop a somewhat more detailed picture of how the water is distributed in the soil. The drawing below shows two highly magnified views of soil, with particles, water, and air spaces to make the point that the soil as a reservoir is different than a simple bucket.
Under normal unsaturated conditions, the water forms a film that clings onto the sediment particles; in this way, water can be distributed throughout the soil rather than accumulating only at the bottom.
The Soil Water System
The flows of the soil water system, as well as its overall structure, can be seen in the schematic diagram below.

Water enters this system through precipitation; it falls to the ground and accumulates in a very thin layer right at the surface (visible only during a rain storm). From this thin film at the surface, the water infiltrates into the soil, where it accumulates in empty pore spaces. Some of the water in the soil percolates down through the intermediate zone into the deeper groundwater, where it flows away from places where the water table is higher; in the situation depicted above, some of the groundwater flows into the stream nearby. Much of the soil water is drawn back up to the surface by plants and by normal evaporation -- these two processes are lumped together as evapo-transpiration.
How we model this system depends in part on what we are interested in studying. If we are interested in the changes that occur over the course of a year, with varying temperatures and plant water demands, that sets a timescale that means we probably should avoid the kinds of changes that are important on a timescale of a second, a minute, or even an hour. On the other hand, if we are interested in these short-term changes, we should avoid trying to imagine how temperature or seasonal vegetation changes come into play. Here, we will explore the dynamics on a yearly time scale.
Model Diagram
Our model is a relatively simple, open system, with just two reservoirs and five flows, arranged in STELLA as shown in the figure below.
The basic units in the reservoirs are set at centimeters of water. This may seem strange -- a reservoir of water that does not contain a volume. But, this approach will be simpler and yet the numerical values will be the same as if we kept track of volumes of water flowing in and out of a field with a surface area equal to one -- 1 m2 or 1 km2. Part of the reason for taking this approach is also because the measured data relating to the dynamics of this system are generally presented in units of centimeters per time unit rather than in volume per time. The basic time unit for our model will be one month, which is reasonable for investigating seasonal changes. So, our flows will have units of cm/month.
Flow Processes in the Soil Water System
Precipitation
To begin with, we will define Precipitation to be a graphical function of time, with time ranging from 1 to 12 and the average monthly precipitation amounts in centimeters on the vertical axis. This means we want 12 data points on our graph. It should be noted that this graph does not really describe vagaries of precipitation, which often comes in unpredictable storms. In our model, we are basically implying that rainfall is steady and continuous, with the intensity varying over the coarse of the year. Later, we can modify this flow in order to represent brief, intense storms.
How should this graph be drawn? The form depends upon the local climate; a few representative samples, given in the figure below, will provide some guidance.
Note that the area under these curves is equal to the total yearly precipitation. To begin with, we will use the mid-latitude continental interior pattern of precipitation.
Runoff
When water falls on the surface faster than the soil can absorb it, the water begins to pool up and form a thin film and then it flows off, over the surface. The magnitude of this runoff flow depends on the amount of water in the surface layer and the slope of the surface and the roughness of the surface that the water flows over. The roughness is a function of the vegetation covering an area. We will define this flow as being equal to a rate constant multiplied by the amount of water in the surface water reservoir. We can vary this rate constant to represent different types of surfaces, but to begin with, we will set it at a value of 0.9 per month. This gives units of centimeters of water per month and this rate constant is equivalent to saying that 90% of the water would flow off the surface each month if none of the water filtered down into the soil.
There is a special case that arises in many parts of the world that we must take into account -- freezing of the surface. When the surface is frozen and precipitation is in the form of snow, the runoff will be zero (some may be lost by the process of sublimation, but it is generally small and we will ignore it here).
So, before we can properly define the Runoff flow in our model, we need to first establish the soil surface temperature, which will be a graphical function of time. The soil surface temperature will more or less follow the air temperature at ground level; representative curves are given in the figure below to provide some guidance.
Now we can formulate a definition for the Runoff flow, making it be dependent on the surface temperature:
Runoff = IF (Surface Temp > 0) THEN Surface Layer * k_Runoff ELSE 0k_Runoff = 0.9
In the model, k_Runoff is defined as a separate converter so that we can more easily change it if we desire. Note that during periods of time when the surface temperature is below zero, the Runoff flow drops to 0, meaning that any precipitation that falls at that time will accumulate in the Surface Layer reservoir -- equivalent to snow piling up during the winter.
Infiltration
The rate at which water infiltrates into the soil is dependent, like the Runoff flow, on the temperature at the surface to the extent that when it is frozen, no infiltration will occur. It is also dependent on the temperature of the soil, because if the soil is frozen, no water can infiltrate. In other words, two conditions must be met in order for any infiltration to occur -- both the surface and the soil must be unfrozen, at a temperature above 0°C.
The next question is how to define the infiltration flow when these two conditions are met -- when the soil and surface are above freezing. Infiltration of water into soil is a reasonably well-studied process, so in defining the infiltration flow in our model, we could look into actual measurements of infiltration rates during a rainstorm, but these values are on the order of 10-20 mm/hr, which converts to 720 to 1440 cm/month -- huge numbers relative to the values for precipitation, which are monthly averages. No such monthly averages exist in the literature on soil water, so we have to take a different approach, one in which we create a steady state model, as shown in the figure below.
Here, we first choose the starting amounts in the reservoirs. The surface layer has a bit of water since the first time step in our simulation will be January and many places have a bit of snow on the surface at that time. The soil layer has 15 cm of water, which is typical for a meter of soil. We assume an average monthly rainfall of 5 cm and given the above equation for the Runoff flow, it will have a value of 1.8 cm/month. At steady state, the sum of the inflows must equal the sum of the outflows, so the Infiltration flow must be 3.2 cm/month. This then gives us the guidance as to what magnitude the infiltration flow must be.
The rate of infiltration will obviously vary for different types of soils, being greater in sandy soils and lesser in clayey soils. In addition, the infiltration is not the same under all conditions for a given soil; instead, it seems to generally follow a pattern in which the rate of infiltration is inversely proportional to the amount of water stored in the soil. The schematic graph below shows a more detailed form of this relationship.
Note the wording of the vertical axis of this graph -- the maximum potential rate of infiltration is used here because if the rate of precipitation is very small, then the rate of infiltration will also be very small, even if the soil is totally dry. In other words, the rate of infiltration may be limited by the rate of precipitation. It is also important to realize that even if the soil is saturated with water, some water can still infiltrate since the soil is losing water to downward percolation into the groundwater reservoir.
In our model, we will specify the relationship between the rate of infiltration and the amount of water in the soil water reservoir in the form of a graphical converter called F Infil. The form of this graph is shown in the figure below.

The infiltration flow itself will incorporate this graph along with some dependence upon the surface and soil temperature. This means that we need to define the soil temperature in our model. The temperature of the soil varies as a function of depth below the surface and the history of surface air temperatures -- it has tendency to lag behind the air temperature and it also damps out the temperature variations of the air above. Accordingly, we will define the soil temperature as follows:
Soil Temp = DELAY(Surface Temp, 0.5) * 0.9
The DELAY function in STELLA gives the value of the chosen parameter (in this case, Surface Temp) as it was some time in the past. Here, we set it to 0.5 time units in the past, or 0.5 months in the past, effectively setting the temperature lag between the soil and the surface to one half of a month. Then, we multiply it by 0.9; this has the effect of reducing the amplitude of the temperature change that the surface undergoes in the coarse of a year.
With this in place, we are now able to define the infiltration flow, using an if-then-else statement:
Infiltration = IF (Surface_Temp > 0) AND (Soil_Temp > 0) THEN F_Infil ELSE 0
This statement simply means that infiltration can only occur when the surface and the soil are not frozen.
Evapo-Transpiration
Evapo-transpiration includes all of the water lost from the soil by the combination of evaporation and transpiration, although in most cases, transpiration is the more important of these two processes. Plants act as water pumps, taking water in through their rootlets, drawing it up through the plant, and ultimately releasing the water in the form of vapor through the pores or stomata in the leaves. The demand for water is thus dependent on the growing season and the kinds of vegetation in a region, but the actual amount of water used in this process represents a kind of compromise between what the plants want and what they can get. As water supplies dwindle, plants adjust by slowing their growth and keeping their stomata closed more of the time; in doing so, they stand a better chance of lasting through the growing season. If they did not adjust their patterns of water consumption, the plants would completely deplete the soil water and perish too early.
In our model, the rate of water loss through evapo-transpiration will be determined by comparing what the plants want and what is available. What the plants want is also called the potential evapo-transpiration, and the figure below shows some representative curves for a variety of different climate types.
We will also build a feature into our model so that no evapo-transpiration can occur if the soil is frozen or if the air temperature is below 0 °C. The precise definition of the flow in our model will be determined using the following set of if-then-else statements.
Evapotrans = IF (Soil_Temp >0) AND (Surface_Temp > 0) THEN Evapotrans_Actual ELSE 0Evapotrans_Actual = IF (Soil_Water>Evapotrans_Potential) THEN Evapotrans_Potential ELSE Soil_Water * 0.9
Here, in the case where the evapo-transpiration potential is greater than the amount of soil water available, we have the plants restrict themselves to half of what is left. This decision to use 0.9 is somewhat arbitrary, but if the number is too low, the growing season will end before the plants have had time to utilize as much water as possible.
Deeper Percolation
The water held in the pore spaces of soil moves downward under the force of gravity, in a process we can call percolation that transfers water from the soil to the groundwater. The rate of percolation is highly dependent upon the type of soil -- sandy soils drain faster than clayey soils -- and also on the amount of water in the soil reservoir. This is because as the soil becomes unsaturated, more and more of the remaining water occurs in the form of a thin film that surrounds the particles of soil, as shown in the drawing above.
Our strategy here is to define a rate of percolation when the soil is saturated, using the assumption of a steady state, as depicted in the figure above. From this, we can see that a flow rate of 3.0 cm/month is the steady state flow rate. If we choose to define the Percolation flow as being equal to a rate constant times the amount of water in the reservoir, then that rate constant in the steady state must have a value of 0.2. So, we construct a graphical converter to define the rate constant, k_Perc, as follows:
Then the flow itself, Percolation is defined in a familiar way:
Percolation =Soil_Water * k_Perc
A summary of the equations used to construct the basic, steady-state model is given below:
Once you have completed the
model, test to see if it is in a steady state, then carry out the
following experiments to explore the effects of seasonal variations
in precipitation, temperature, and potential evapo-transpiration.
These experiments should help you gain a better understanding of the
dynamics of this system that is so important to
agriculture.
Experiments
1. Investigate Effects of Seasonal Variations (Separately)
If you try to understand this system with all possible seasonal variations operating in the same model (i.e., simulating the realistic variations for a particular climate), you will have difficulty interpreting and understanding the results. You will see that our seemingly modest system exhibits some pretty complicated behavior. A good way of beginning to understand this system is to change just one thing at a time and understand how all parts of the system respond to this change. Our strategy then, is to focus on the seasonal variations one at a time before combining them.
For each of the following experiments, make the required changes and run the model from 1 to 12, with a time step of 0.1 using Euler's Method of integration. Make a detailed prediction of at least the qualitative changes that you think will result from the seasonal variation. Then graph all of the reservoirs and flows in a series of plots and examine the results until you can explain why each system component changes as it does. Then, remove the seasonal variation and check to see that the system is back in the steady state before proceeding with the next experiment.
1a) Vary Potential Evapo-transpiration over the coarse of a year, following the graph shown above for the mid-latitude continental interior climate.1b) Vary the Surface Temperature, following the graph shown above for the mid-latitude continental interior climate.
1c) Vary the Precipitation, again following the graph shown above for the mid-latitude continental interior climate.
2. Combine Seasonal Variations
Now implement all three seasonal variations from above. Make a detailed prediction about how the soil and surface water reservoirs will change over the course of a year before running the model. One interesting thing to graph here is the Potential Evapotranspiration and the Actual Evapotranspiration -- this will allow you to identify times of the year when there is a water deficit. Another thing to consider here is whether there is a particularly important time of the year for recharging the soil water reservoir between growing seasons.
3. Effect of Altering Runoff, Infiltration, and Percolation
Use the model as modified after experiment #2 as a control for this experiment. First, change the k_Runoff parameter from 0.9 to 0, which might reflect a change in topography from a slope to the flat center of a valley. Next change the Infiltration flow by reducing its value by one-half; to do this simply click on the Infiltration flow and multiply the f_Infil by 0.5. This would be analogous to having a dense, compacted soil. Finally, do the same for the Percolation flow, reducing it by half. Before each of these experiments, make a prediction about how the system's behavior will change. In attempting these predictions, it will be useful to carefully study the control case.
4. Comparison of Soil Water Dynamics Among Different Climate
For this experiment, create 3 parallel models by copying and pasting the original and then set them up so that one represents the continental climate (exp #2), one represents the Mediterranean climate, and the other represents the tropical climate; insert the appropriate curves for precipitation, surface temperature, and potential evapotranspiration. Now you can plot similar features of all 3 models (i.e., the two reservoirs) to gain an understanding of how the climates control the balance of water in the soil, and also how the climate effectively places restrictions on the growing period.
RETURN TO TOP
RETURN TO HYDROSPHERE PAGE
RETURN TO MAIN PAGE


